
Pedestrian Crash Statistics
Chapter 1 provided an overview of the need to provide a more pedestrian-friendly environment along and near streets and highways. This chapter provides an overview of the pedestrian safety problem and related factors that must be understood to select appropriate countermeasures and strategies to improve pedestrian safety and mobility. A brief description of the pedestrian crash problem in the U.S. is discussed in the following sections. Similar statistics should be produced for states and municipalities to better understand the specific problems at the community level and select appropriate countermeasures.
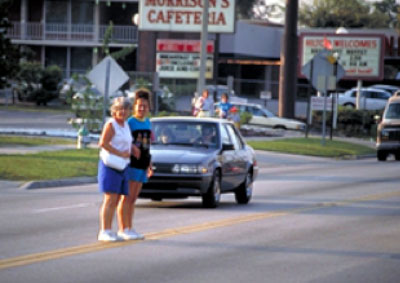
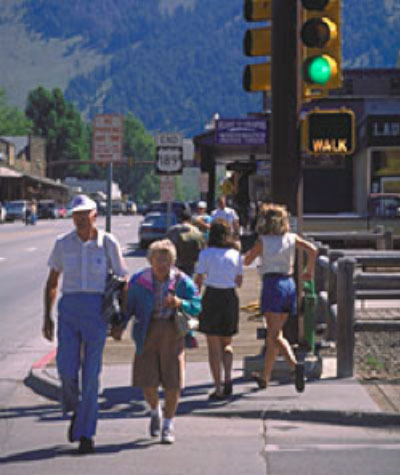 In urban areas, pedestrian crashes often cluster near signalized intersections.
Magnitude of the Problem
In 2011, 4,612 pedestrians were reported to have been killed in motor vehicle crashes in the U.S. This represents a four percent increase from the 4,280 pedestrians that were killed in 2010, but a 9 percent decrease from 2001.3 Pedestrian deaths in 2011 accounted for 13 percent of the 32,367 total motor vehicle-related deaths nationwide.1 In 2011, an estimated 69,000 pedestrians were injured in motor vehicle collisions, which represent approximately 3 percent of the roughly 2.2 million total persons injured in traffic crashes.1 The decrease in pedestrian fatalities from 2001 to 2011 may partly be attributable to a greater focus in recent years on providing safe pedestrian accommodations in cities across the country. The need to reduce pedestrian deaths and injuries while promoting increased walking continues to be an important goal for transportation professionals.
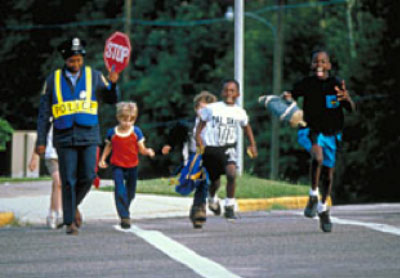 Safety of children in school zones must be given proper attention and appropriate safety measures.
Pedestrians Most at Risk
In general, males are more likely to be involved in a crash than females; in 2011, 70.6 percent of pedestrian fatalities were male, and the male pedestrian injury rate was 4 injuries per 100,000 population higher than for females.1 Crash injury rates by population are highest for males between the ages of 16-20 and for females between the ages of 16-20. Males aged 5 to 9 and males and females aged 10 to 15 are also particularly at risk, as they are more reliant on walking as their primary mode of transportation, though this may not be reflected in the data. This problem may be compounded by the speed of vehicles in areas where children are walking and playing.
In general, injury rates for older persons (age 65 and over) are lower than for most age groups, with the exception of children under the age of 5, which may reflect greater caution by older pedestrians (e.g., less walking at night, fewer dart-outs), a reduced amount of walking near traffic and a lack of mobility for some older adults. However, older adult pedestrians are much more vulnerable to serious injury or death when struck by a motor vehicle than younger pedestrians. Older pedestrians make up 13 percent of pedestrian fatalities.1 Per 100,000 in population, both male and female pedestrians aged 75 and older have the highest fatality rate at 3.43 for male pedestrians and 2.31 for female pedestrians. Compared to the rates of less than 0.65 per 100,000 for both male and female children aged 15 and younger, it is clear that older pedestrians are much more vulnerable.1 Furthermore, with many older adults unable or unwilling to drive, elder pedestrians often choose walking as the best mobility option. The aging population in the U.S. may also be a factor in deaths involving older pedestrians.
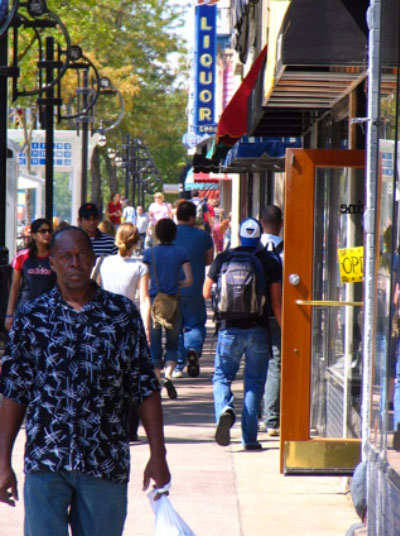 Minority populations are more likely to be involved in a pedestrian crash.
Minority Populations
Minority populations are more vulnerable to involvement in pedestrian-motor vehicle crashes, based on vehicle ownership rates and the percentage of trips taken by walking among minority populations. African-Americans and Hispanics are more likely to walk to destinations, increasing their exposure to potential traffic conflicts. Roughly 19 percent of African-Americans reside in households without access to a vehicle, in contrast to 13.7 percent of Hispanics and only 4.6 percent of Caucasians.4 In addition, only 9.65 percent of all trips by Caucasians are made on foot, while African-Americans and Hispanics travel on foot 12 percent and 14.2 percent of the time, respectively.5
According to Centers for Disease Control and Prevention data, pedestrian fatality rates are higher for minorities. Â African-Americans and Hispanics, when involved in collisions with motor vehicles, have a fatality rate of 2.39 and 2.23 per 100,000 population, respectively. Caucasians, on the other hand, have a fatality rate of 1.38 per 100,000 population.6
 Wide multilane roadways without median crossing islands pose significant risks to crossing pedestrians.
Area Type
Pedestrian crashes occur most frequently in urban areas where pedestrian activity and traffic volumes are greater compared to rural areas. The 2008 NHTSA National Pedestrian Crash Report indicated that 67 percent of pedestrian fatalities relating to pedestrian-motor vehicle crashes occurred in urban areas as opposed to rural areas, using data from 1997 to 2006.7 This data indicates that the majority of pedestrian crashes occur in urban areas.
While pedestrian crashes occur more frequently in urban areas, rural pedestrian crashes are nearly twice as likely to result in a fatality as urban pedestrian crashes. A majority of rural pedestrian crashes occur at night, at midblock locations, and involve high vehicle speeds and two-lane roads that lack sidewalks or paved shoulders.8
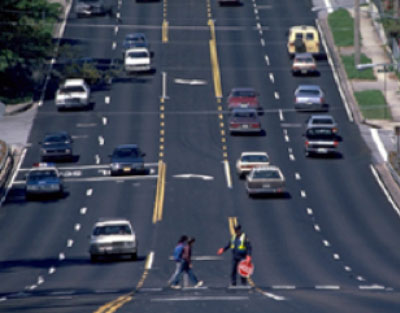
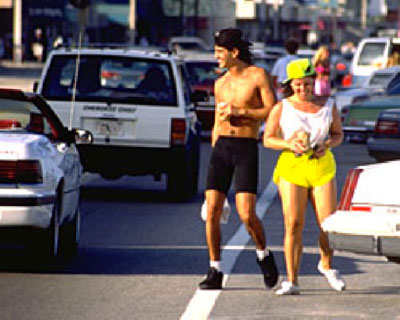
 Pedestrians who choose the most direct path to cross the street may place themselves at greater risk.
Location Type
Across all age groups, pedestrians are considerably more likely to be killed at non-intersection locations than at intersections. Roughly 68 percent of crashes resulting in a pedestrian fatality occurred at non-intersections in 2010, and nearly 70 percent of pedestrian fatalities occurred at non-intersection locations in 2011.1, 2 In contrast, pedestrian injury crashes tend to occur more often at intersections than non-intersections, with some exceptions. For example, people aged 35-44 are more likely to be injured at intersections, while people aged under 5 have a roughly equal likelihood of being injured in a crash at an intersection or non-intersection location.
Pedestrians age 75 and older are more likely to be killed at non-intersection locations 56 percent) compared to intersections (33 percent), though intersection crashes account for more injuries to this age group.1 Some older pedestrians have diminished physical and visual abilities that make street crossings more challenging. In recent years, an emphasis has been placed on improving the design criteria used by engineers to ensure that the needs of all users are being met; the Highway Design Handbook for Older Drivers and Pedestrians and the Guidelines and Recommendations to Accommodate Older Drivers and Pedestrians are helpful resources.9, 10
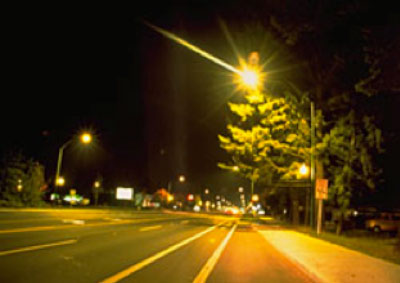 Fatal pedestrian collisions occur more often during periods of darkness.
Time of Occurrence
As of 2011, pedestrian injury crashes were most prevalent during lunchtime and afternoon peak periods, when the traffic levels are high, as well as during evening hours. In contrast, fatal pedestrian crashes typically peak later in the day, between 6 and 12 p.m., where darkness and alcohol use are more predominant factors. This is particularly the case on weekends, when more than 72 percent of fatalities and injuries occur between 6 p.m. and 3 a.m.1 As of 2010, 57.3 percent of all pedestrian fatalities occurred between 3 p.m. and midnight, and 41 percent of all pedestrian fatalities occurred on weekends.1
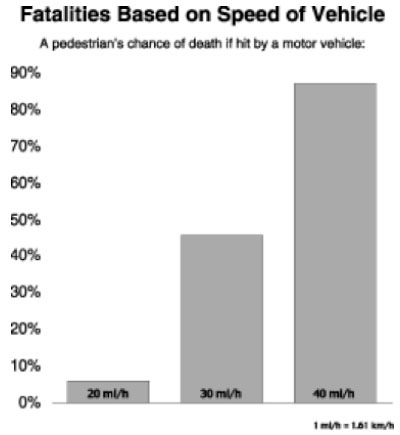 Source: U.K. Department of Transportation, Killing Speed and Saving Lives, London, 1987.
 Vehicle Speed
Vehicle speeds are a major contributing factor in crashes of all types. According to the National Pedestrian Crash Report from 2008, the largest percentage of pedestrian fatalities, roughly 32 percent occurred on roads with speed limits of 50 miles per hour or greater, using data from 1997 to 2005. Roads with speeds of 30 to 39 and 40 to 49 accounted for 29.1 percent and 24.5 percent of all pedestrian fatalities, respectively.7 Speed has serious consequences when a pedestrian is involved. A pedestrian hit at 64.4 km/h (40 mi/h) has an 85 percent chance of being killed; at 48.3 km/h (30 mi/h), the likelihood goes down to 45 percent, while at 32.2 km/h (20 mi/h), the fatality rate is only 5 percent.10 Faster speeds increase the likelihood of a pedestrian being hit. At higher speeds, motorists are less likely to see a pedestrian, and are even less likely to be able to stop in time to avoid hitting one.
 Alcohol impairment continues to be a serious problem for pedestrians involved in motor vehicle collisions.
Alcohol Involvement
Driving under the influence of alcohol is a well-publicized issue in this country. In 2010, alcohol involvement for either the pedestrian or the driver was reported in 47 percent of fatal pedestrian crashes in the U.S. Of the 4,227 traffic crashes that resulted in a pedestrian fatality in 2010, 33 percent involved pedestrians with a BAC of 0.08 or greater and 14 percent involved drivers with a BAC of 0.08 or greater. More than half of the pedestrian fatalities in the age groups of 21-24, 25-34, 35-44, and 45-54 involved pedestrians with a BAC of greater than 0.01 (54 percent, 56 percent, 51 percent, and 51 percent, respectively). In all, approximately 46 percent of pedestrians between the ages of 21 and 54 that were killed in a pedestrian-motor vehicle crash had a BAC of over 0.08.1